From page 32–33 of The Neatest Little Guide to Stock Market Investing:
Price/Sales Ratio (P/S or PSR)
This is one of my favorites. P/E compares price to earnings, price/book compares price to liquidation value, and price/sales or PSR compares price to sales revenue. To determine a stock’s PSR, simply take the company’s total market value and divide it by the most recent four quarters of sales revenue. Sometimes you’ll know the price per share and the sales per share. In fact, we use both on this book’s stocks to watch worksheet. In that case, simply divide the price per share by the sales per share to get PSR. ...

“So what?” you might say. “It’s profits I care about, not sales.” That’s a common objection to using PSR. But remember from the explanation of earnings on page 28 that companies can manipulate earnings all sorts of ways. They use accounting rules that are flexible to interpret how much it costs them to do business and then subtract that number from revenue to get earnings. The flexible accounting can spit out small or big numbers as needed. But with sales revenue, there’s not a lot to adjust. It’s just what you sold—end of story.
I looked at the winter 2012 PSRs of Coca-Cola and PepsiCo.
Coca-Cola had a market value of $153 billion and sales of $46 billion. That produced a 3.3 PSR. PepsiCo had a market value of $103 billion and sales of $65 billion, for a 1.6 PSR. These numbers revealed something important to investors considering both stocks. People were paying $3.30 for each dollar of Coke’s sales, but only $1.60 for each dollar of Pepsi’s sales. Aha! By PSR measure, Pepsi was a better bargain than Coke.
Was that enough to warrant buying shares of Coke instead of shares of Pepsi? Not by itself, but it would have been useful to know if you had been searching for stocks with compelling valuations. Here’s how these two fared over 2012 and 2013:
That’s a 25% return for Coke and a 32% for Pepsi, so maybe the book’s example proved prescient. If the only piece of information you had had to go on in winter 2012 was price/sales, and the lower one ended up flagging the better performance to come, you might reasonably conclude that PSR had indeed unearthed a superior value.
But of course, there’s always more to the story than just one metric. Maybe Pepsi outperformed Coke operationally in these years. Maybe it ran better publicity. It’s hard to know what’s causative and what’s coincidental. But at least in this one example from the book, a lower PSR did indeed flag the better investment.
Let’s see how price/sales ratios have changed since then.
Price/Sales Ratios Today
Now, Coca-Cola (KO $65 +11% YTD) and PepsiCo (PEP $166 -2% YTD) sport PSRs of 6.1 and 2.5, respectively, an even bigger disparity than in winter 2012. Back then, Coke was 2.1x more expensive by this measure. Now it’s 2.4x more expensive.
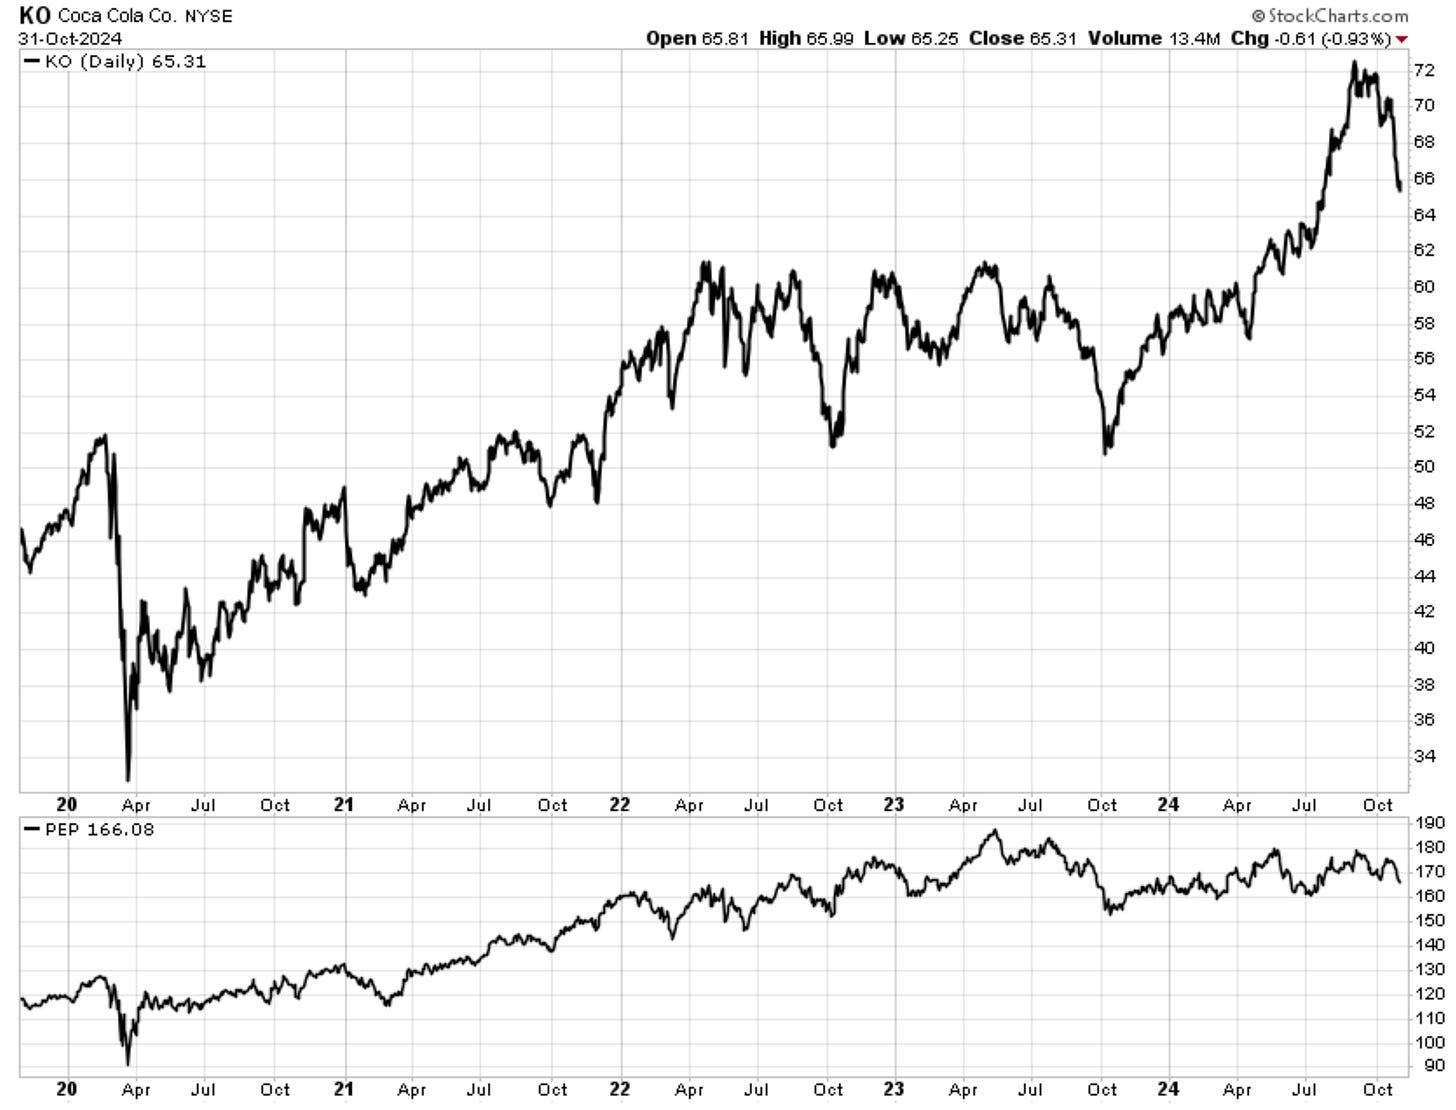
What might be causing this? It could be that shares of Coke have outperformed shares of Pepsi in recent years. Let’s find out. Here’s a five-year comparison chart:
That’s a 43% return for KO and a 41% for PEP—call it a wash. In a blind taste test, no investor would have noticed a difference. So that’s not why.
It could be Coke’s stronger brand power making it more appealing to investors, leaving them willing to pay a higher price. Or maybe it’s not actually more expensive when viewed through other lenses. That’s the conclusion recently drawn by Motley Fool analyst Collin Brantmeyer, who wrote in September:
Despite PepsiCo’s net sales being nearly double those of Coca-Cola, it has a smaller market capitalization of $243.9 billion compared to Coca-Cola’s $306.8 billion. That’s because Coca-Cola is more profitable, thanks to its higher gross margin and operating margin. Over the last 12 months, Coca-Cola generated $9.1 billion in free cash flow, while PepsiCo produced $7 billion.

Another factor contributing to PepsiCo’s lower market capitalization is its higher debt burden. PepsiCo holds $38.3 billion in net debt, whereas Coca-Cola has $24.8 billion. ...

Coca-Cola’s debt has decreased by 15.8% over the past five years, while PepsiCo’s has surged by 42.9%. This has resulted in a higher interest expense for PepsiCo—$854 million in the past 12 months, compared to Coca-Cola’s $545 million.

In terms of valuation, Coca-Cola is slightly better priced. Its price-to-free cash flow ratio is 34, compared to PepsiCo’s 35.2, making Coca-Cola the cheaper stock.

From Coca-Cola vs. PepsiCo
by Collin Brantmeyer
Motley Fool, September 2024
Just as there are many ways to skin a cat, there are many ways to value a stock.
Megatech Price/Sales
You frequently read that megatech stocks are overvalued. Does this show up in their price/sales ratios? Let’s have a look, using the so-called Magnificent Seven stocks.
They are the megatech growth stocks Amazon, Apple, Google, Meta, Microsoft, Nvidia, and Tesla. In 2023, Bank of America analyst Michael Hartnett referred to them as “The Magnificent Seven,” after the 1960 Western film, and the name stuck.
The following are the current PSRs of the Magnificent Seven stocks:
Magnificent Seven
Price/Sales Ratios
– – – – – – – – – – – – – – –
3.3 AMZN
6.5 GOOG
9.1 AAPL
9.3 TSLA
10.4 META
11.9 MSFT
34.3 NVDA
By this measure, only shares of Amazon are cheaper than shares of Coke. Everything else is more expensive, all the way up to shares of Nvidia having a PSR 5.6x higher than Coke’s.
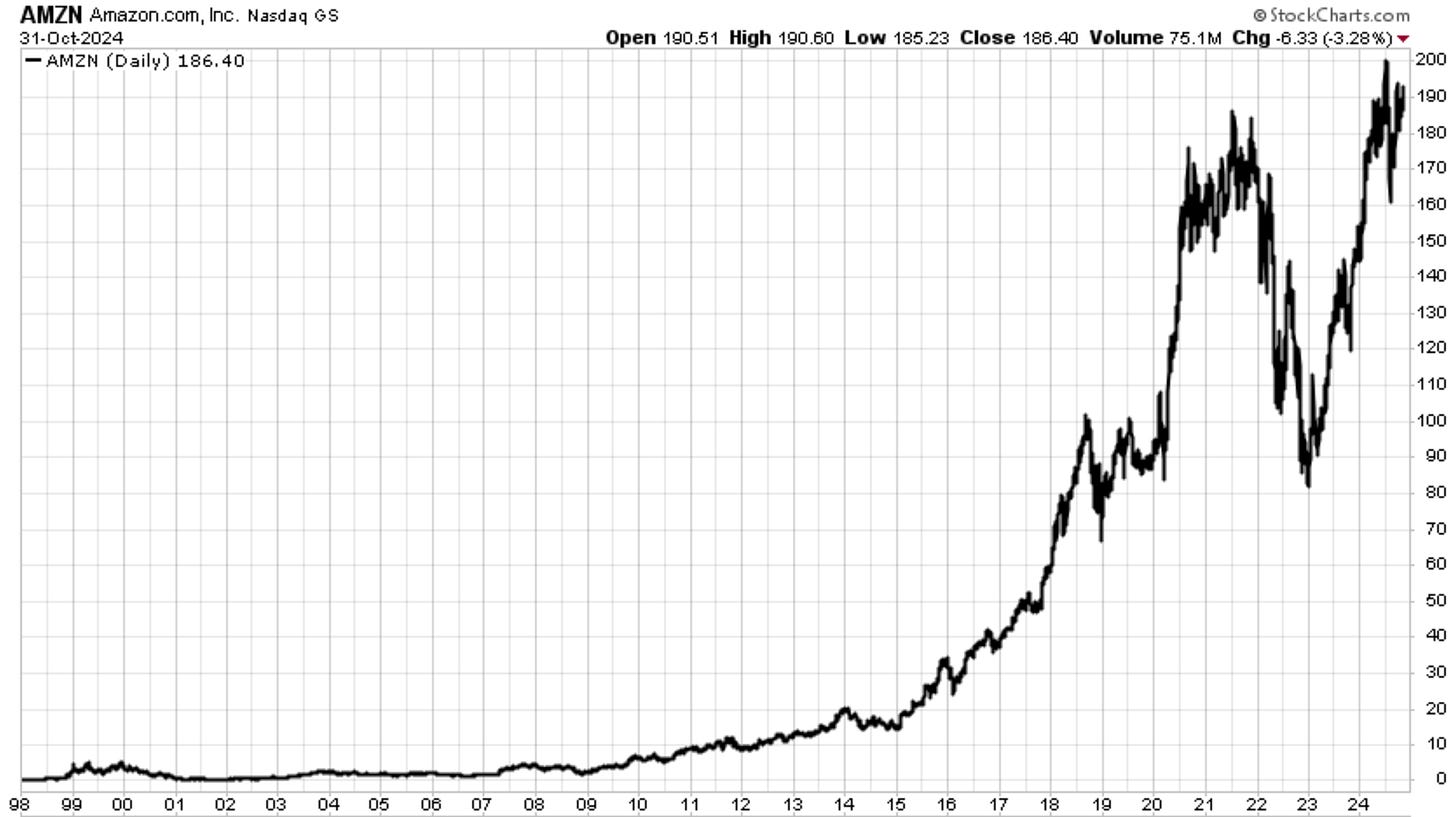
The most common explanation is that they’ve grown more and created greater excitement around their futures. Investors are willing to pay up for potentially brighter prospects on the horizon. This is not entirely irrational. When judged by traditional valuation analysis, shares of Amazon have been overpriced since going public in 1997, yet they’ve done this:
As shoppers know, you get what you pay for.
For some stocks, paying a higher multiple—whether price/sales, price/earnings, or price to anything else—can be worth it. Just ask any investor who bought Amazon shares at its IPO and held on, despite years of analyst warnings about its supposed overvaluation. Some analysts used to laugh at Amazon losing money on every sale, joking that it should try making up for it in volume. (Get it? If you lose money on every sale, more volume equals greater losses—yuk, yuk.) But who’s laughing now?
Historical perspective can be helpful to value investors. We see that tech stocks are generally more expensive than non-tech stocks, and often accept that their higher valuation is warranted. But are they even more expensive today than usual?
Let’s see.
According to GuruFocus, the following are the median PSRs for the Magnificent Seven stocks over the past 13 years:
Magnificent Seven
Median 13-Year PSRs
– – – – – – – – – – – – – – –
3.2 AMZN
4.5 AAPL
6.3 GOOG
7.2 TSLA
8.6 MSFT
9.5 META
14.4 NVDA
Next, let’s compare their current PSRs to their 13-year median PSRs to see how much more expensive they are today as a multiple of their median PSRs:
Magnificent Seven
Current PSRs as
Multiples of 13-Year
Median PSRs
– – – – – – – – – – – – – – –
1.03 AMZN
1.03 GOOG
1.09 META
1.29 TSLA
1.38 MSFT
2.02 AAPL
2.38 NVDA
Surprised? By this measure, shares of Amazon and Google are not overvalued compared with their 13-year medians, and even the most expensive megatech, Nvidia, is trading at only 2.38 times its median price/sales ratio. Notably, shares of Coke trade at 1.05x their 13-year median PSR—an “overvaluation” greater than the 1.03x of Amazon and Google.
The fact is, the Magnificent Seven are all highly successful businesses that have managed to grow their results in line with expectations over time. On average, they’re trading at PSR multiples 1.5x their 13-year median, which may be reasonable given AI’s potential and their race to develop it.
Still Relevant — and Timely
Price/sales remains a relevant measure of valuation, quickly showing how much you’re paying for each dollar of revenue.
It’s also timely, revealing at a glance that valuation concerns over the silicon septuplets may be overstated. These megatechs have proven their ability to turn market dominance into cash, something that separates their levitation from the dot-com bubble of the late 1990s. Their hard charge at artificial intelligence is itself expensive, but as a potential societal turning point, it may justify the cost.
The PSR suggests the Magnificent Seven’s lofty perch might be more secure than naysayers would have us believe. The emperor, it seems, is not only clothed but sporting rather fashionable attire.


