Research to Riches, Part 3
Newsletters.
This is Part 3 of a 7-Part Research-to-Riches series:
Part 1 — Financial magazines
Part 2 — Financial newspapers
Part 3 — Newsletters (you are here)
Part 4 — Value Line
Part 5 — Companies themselves
Part 6 — Stock Screeners
Part 7 — The Internet
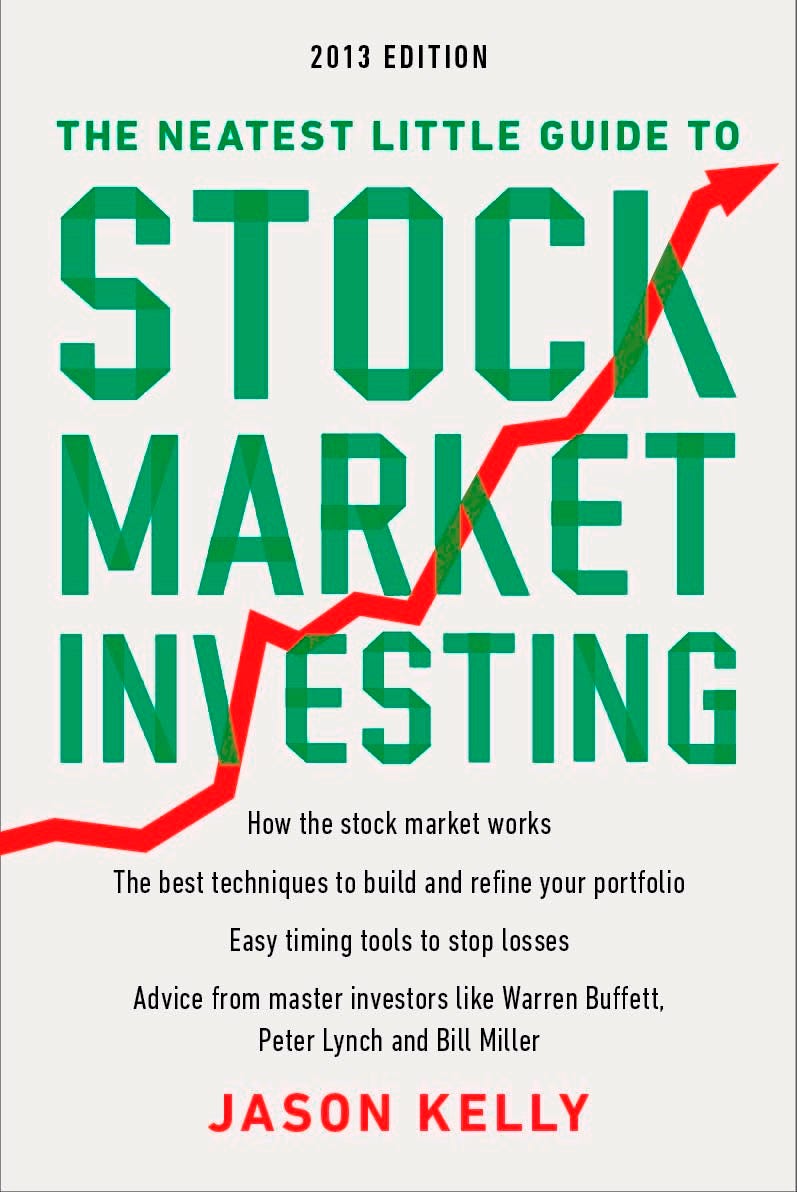
The “Newsletters” section of Chapter 6 in The Neatest Little Guide to Stock Market Investing opens as follows:
A newsletter should be a trusty friend who accompanies you through good times and bad. It’s important that you like the relationship that a newsletter editor builds with you. He or she should be honest, admit mistakes, and work hard to help you get ahead. Nobody is perfect in the stock business, but somebody who can provide you with a steady stream of good ideas in an understandable manner will prove worth the subscription price.The section provides an overview of six newsletters:
Dick Davis Investment Digest
Grant’s Interest Rate Observer
The Kelly Letter
Morningstar StockInvestor
The Outlook Online
Outstanding Investor Digest
Cabot Wealth acquired Dick Davis Digest and it disappeared into the company’s fourteen publications, which cover everything from cannabis to options.
The Outlook didn’t survive the restructuring of Standard & Poor’s into S&P Global Ratings, which is unfortunate. The letter’s STARS and Fair Value rankings offered a helpful filter to stock researchers. From the book’s “S&P STARS/Fair Value” section:
Standard & Poor’s uses its STARS system to predict a stock’s potential over the next 12 months. STARS stands for Stock Appreciation Ranking System, and classifies stocks from 1 to 5 with 5 being the best. ...

Fair value is a rank of the stock’s recent trading price compared to what S&P considers its fair value. We’d all prefer to buy stocks at a price way below their fair value. Therefore, S&P ranks all stocks on the handy 1 to 5 scale with 5 again being the best. ...

Best of all is a stock ranked 5 STARS and with a fair value rank of 5. That combination, by the way, is what the platinum portfolio requires for a stock to enter. So, for a quick list of stocks that are ranked high in both categories, take a look at the S&P platinum portfolio list.
Too bad it’s gone.
And so is Outstanding Investor Digest, about which Warren Buffett wrote: “I’d advise you to subscribe. I read each issue religiously. Anyone interested in investing who doesn’t subscribe is making a big mistake.” From the book:
That’s about as much endorsement as any publication should ever need. Outstanding Investor Digest is a collection of the best ideas from the brightest investment minds around. It prints exclusive interviews, excerpts from letters to shareholders, conference call transcripts, and other “inside” scoops. ... It’s an investment gold mine.Now the entrance to the mine is sealed, its riches just a memory. I miss OID.
That leaves just three of the original six newsletters profiled still in publication. The good news is that all three are going strong.
In this Part 3 of Research to Riches, I’ll focus on them.
Grant’s Interest Rate Observer
From the fifth edition:
If you’re looking to read what the pros read and to use the information better than they do, consider Grant’s, self-described as “the financial-information medium that least resembles CNBC.” Grant’s publishes some of the most insightful market commentary I’ve found. In a wry tone, the editors deliver a careful look at balance sheets, CEO comments, analyst recommendations, and the disposition of the market. In their own words, “Not knowing exactly what the future may bring, we try to identify change where it most frequently occurs: at the margin.”On the website, founder James Grant writes:
“We value original thinking, thorough financial analysis, clear writing, and smart, demanding readers like you. Welcome to the world of Grant’s Interest Rate Observer.”
The flagship publication goes out every other Friday, 24 times per year. The front page of the October 27, 2023 issue looked like this:
From the first column:
“[W]e face a possible dollar inflation uncertainty nightmare,” writes the economist Charles W. Calomiris, in—of all places—a quarterly journal of the Federal Reserve System. …
Calomiris chooses to preface his article with an excerpt from the Feb. 16 Financial Report of the United States Government, which reads: “Under current policy and based on this report’s assumptions, [government debt relative to GDP] is projected to reach 566% by 2097. The projected continuous rise of the debt-to-GDP ratio indicates that current policy is unsustainable.”
Quite right, Calomiris tells Grant’s, it is unsustainable. Today’s ratio of federal debt to GDP—more or less 100%—is “within the range associated historically with the fiscal dominance ceiling.”
On page 5, deputy editor Evan Lorenz tackled the then-popular view that small-cap stocks had permanently lost their performance advantage. From his report, “For the little guy,” comes the following:
Since year-end 2016, the Russell 2000 has lagged the S&P 500 by a startling 78.8 percentage points, including reinvested dividends. In times gone by, a phase of small-cap underperformance would give way to a phase of small-cap outperformance, and vice versa. We proceed with the working hypothesis that the cycle will turn again. …
It’s a curious historical fact that small-cap valuations sometimes appear rich, not cheap, at bullish turning points. Thus, from the March 10, 2000 peak of the dot-com bubble through the start of the Great Recession in December 2007, the Russell 2000 outperformed the S&P 500 by 19.8 percentage points. You might not have guessed it, given that, at maximum tech frenzy, the small-cap gauge traded at 143 times trailing earnings versus 27.5 times for the S&P. The reason was not, as it is today, the prevalence of money-losing index components, but that small-cap valuations, too, were being inflated by the likes of MicroStrategy, Inc., BroadVision, Inc. and Internet Security Systems, Inc. In the spring of 2000, each company traded at more than 1,000 times earnings.
The small-cap rotation that Grant’s suggested was on the way is just now beginning. It was prophesied to Lorenz by Rob Arnott, founder and chairman of Research Affiliates, LLC, thusly:
“Our models suggest that, at this deep discount, we would expect small cap to beat large cap by 5.5% per year over the coming five years. I think that might be too conservative. . . . From this deep a discount over the past 55 years, small cap has historically beat large cap by roughly 800–2,000 basis points per annum over the subsequent five years.”
Since the October 27, 2023 publication date, here’s how the S&P 500 (large companies) and S&P 600 (small companies) have performed:
Level Change
10/27/23 – 11/27/24 (%)
– – – – – – – – – – – – – – –
45.7 S&P 500
43.1 S&P 600
Pretty close, and recently, small caps have done much better:
Level Change
6/27/24 – 11/27/24 (%)
– – – – – – – – – – – – – – –
9.4 S&P 500
19.1 S&P 600
It looks like Grant’s was onto something, as is frequently the case.
A one-year subscription in the US or Canada costs $1,825:
The Kelly Letter
This is my newsletter, where I run three growth plans and an income plan in a rules-based, systematic portfolio. The growth plans sell quarterly surpluses and buy quarterly shortfalls along a signal line, a process that looks like this:
When you are guided by math instead of emotion, you see the world differently. Shrill voices, complicated charts, and raised eyebrows become just price pressures. You depart every forecast thinking, “Maybe,” and not caring whether it ends up right or wrong. Eventually, the aggregation of pressures will push key prices in your plans up or down, and your system will react by selling or buying.
It works, with no stress from indecision, quarter after quarter. Here’s its recent performance, through last Friday:
From the description of The Kelly Letter in the fifth edition:
I interpret the week skeptically in search of things mispriced, and build relationships with readers by emphasizing discussion over data. One subscriber wrote, “This newsletter remains the most understandable review of the market I’ve ever read.” Many claim, “There’s no better way to start a Sunday.”The following is the introduction to the Sunday, November 24, 2024 issue:
The rotation is back, with smaller caps leading again. If this cycle between megatech and smaller caps continues, our plans will find themselves always in a sweet spot.
Financial fretting last week fixated on three perennial favorites: the Fed’s rate-reduction schedule, inflation’s next trick, and whether market valuation has finally rung the alarm bell.
Hibernation-deprived bears united behind their favorite chorus: “What goes up must come down.” They say stocks have risen so powerfully for so long, and are so overvalued, they’re cruising for a bruising.
The AI-is-dot-com crowd continues its tenuous comparison, despite the two eras bearing no resemblance beyond involving tech. The faster profit growth and widening margins of the AI boom differentiate it from dot-com, and those characteristics can support a higher valuation. Dot-com lacked them, such that connecting the eras is like comparing a Formula 1 car to a soapbox derby because both have wheels.
A case-in-point is Nvidia, which reported 94% annual revenue growth in its latest quarter, to $37.5B. It’s now the world’s most valuable company, churning more profit than Amazon and Meta. These are business results measured in dollars, not clicks or other fantasies of the dot-com era.
We’ll keep our plans focused where they’ve been from the start: historically outperforming smaller companies, and America’s innovative megatech. Diversification’s mediocrity tax will not bankrupt our performance.
Let’s get to it, starting with Fed tea leaves.
A one-year subscription costs $200:
Morningstar StockInvestor
From the fifth edition:
Morningstar is an industry heavyweight, first making its name in mutual funds and then moving on to stocks. Its StockInvestor newsletter contains aggressive and conservative portfolios, analyst commentary, and a list of stocks to sell. The publication focuses on strategies used by successful investors and tries to put those strategies into a usable form. The smart table design and astute writing make this one of the most enjoyable reads on the marketplace, and profitable too. Its analysts hunt for “durable stocks trading at a discount,” defined as “companies with economic moats that are trading at discounts to their intrinsic values.”
An economic moat is a metaphor describing a company’s ability to maintain a competitive advantage and protect its profit-making capability over the long term. Picture a medieval castle surrounded by a moat—it’s harder for attackers (competitors) to breach.
In investing, a company with a strong economic moat can fend off competition and sustain its position in the market. This advantage can generate consistent profits and growth, making the company attractive to long-term investors.
The following are common types of economic moats:
Brand Loyalty: Customers prefer a specific brand (e.g. Coca-Cola) and are less likely to switch to competitors, even if alternatives are cheaper.
Cost Advantage: A company produces goods or services more efficiently than competitors, allowing it to offer lower prices or achieve higher profit margins (e.g. Walmart).
Network Effect: The value of a product or service increases as more people use it (e.g. social media platforms like Facebook). Once everyone is on, everyone needs to be on to reach everyone else. It’s hard to disrupt this, although Elon Musk has managed to do so at X, disappointing enough users to launch Bluesky as an alternative that may become the new Twitter. Barring a similar billionaire boo-boo, Bluesky should benefit from the network effect.
Intellectual Property: Patents or copyrights that legally prevent competitors from copying products or services (e.g. pharmaceutical companies).
High Switching Costs: Customers face difficulty or expense when changing to a competitor’s product (e.g. software like Microsoft Office or Adobe).
Companies with strong economic moats can better withstand competition, making their stock potentially safer and more valuable over the long haul. Morningstar StockInvestor looks for companies with such advantages, hoping to buy them on sale.
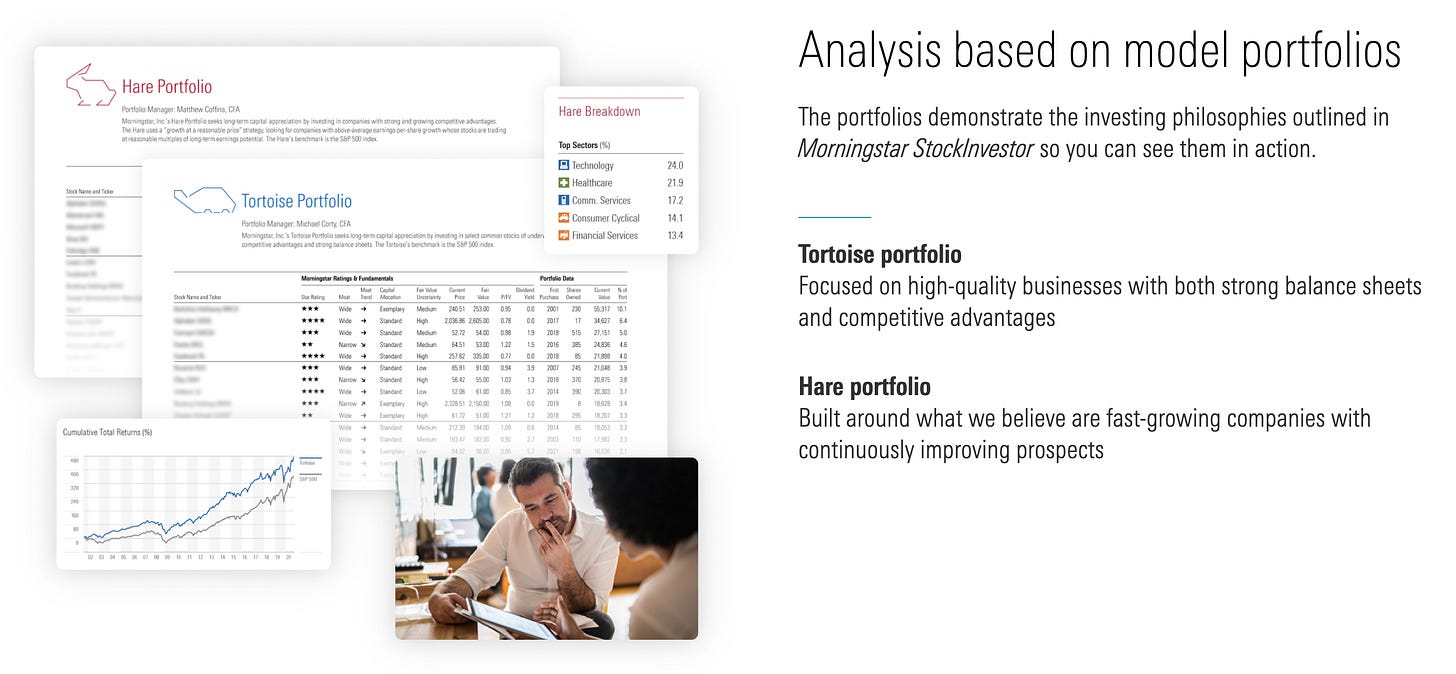
It offers “tortoise” and “hare” portfolios:
A one-year digital subscription costs $170:
Coming in Part 4: Value Line.


