This is Part 4 of a 7-Part Research-to-Riches series:
Part 1 — Financial magazines
Part 2 — Financial newspapers
Part 3 — Newsletters
Part 4 — Value Line (you are here)
Part 5 — Companies themselves
Part 6 — Stock Screeners
Part 7 — The Internet
The “Value Line” section of Chapter 6 in The Neatest Little Guide to Stock Market Investing opens as follows:
Value Line publishes the premier stock research tool, The Value Line Investment Survey. It covers around 1,700 companies. Almost everything you could want to know about each company is condensed to a single page. When you get to this book’s strategy and begin filling out the Stocks to Watch worksheet in the back, you’ll use Value Line exhaustively.

Begun by Arnold Bernhard during the Great Depression, Value Line boasts more than 100,000 subscribers today. If you count the number of people who look at reports from libraries or photocopies from brokers, Value Line’s users number in the millions. The company’s analysts have learned a thing or two about stock research over the past seven decades. Let’s take a closer look at The Value Line Investment Survey. First, we’ll look at IBM’s profile back in 1997, then we’ll look at its profile in 2012. Seeing how a company evolves over time is helpful.
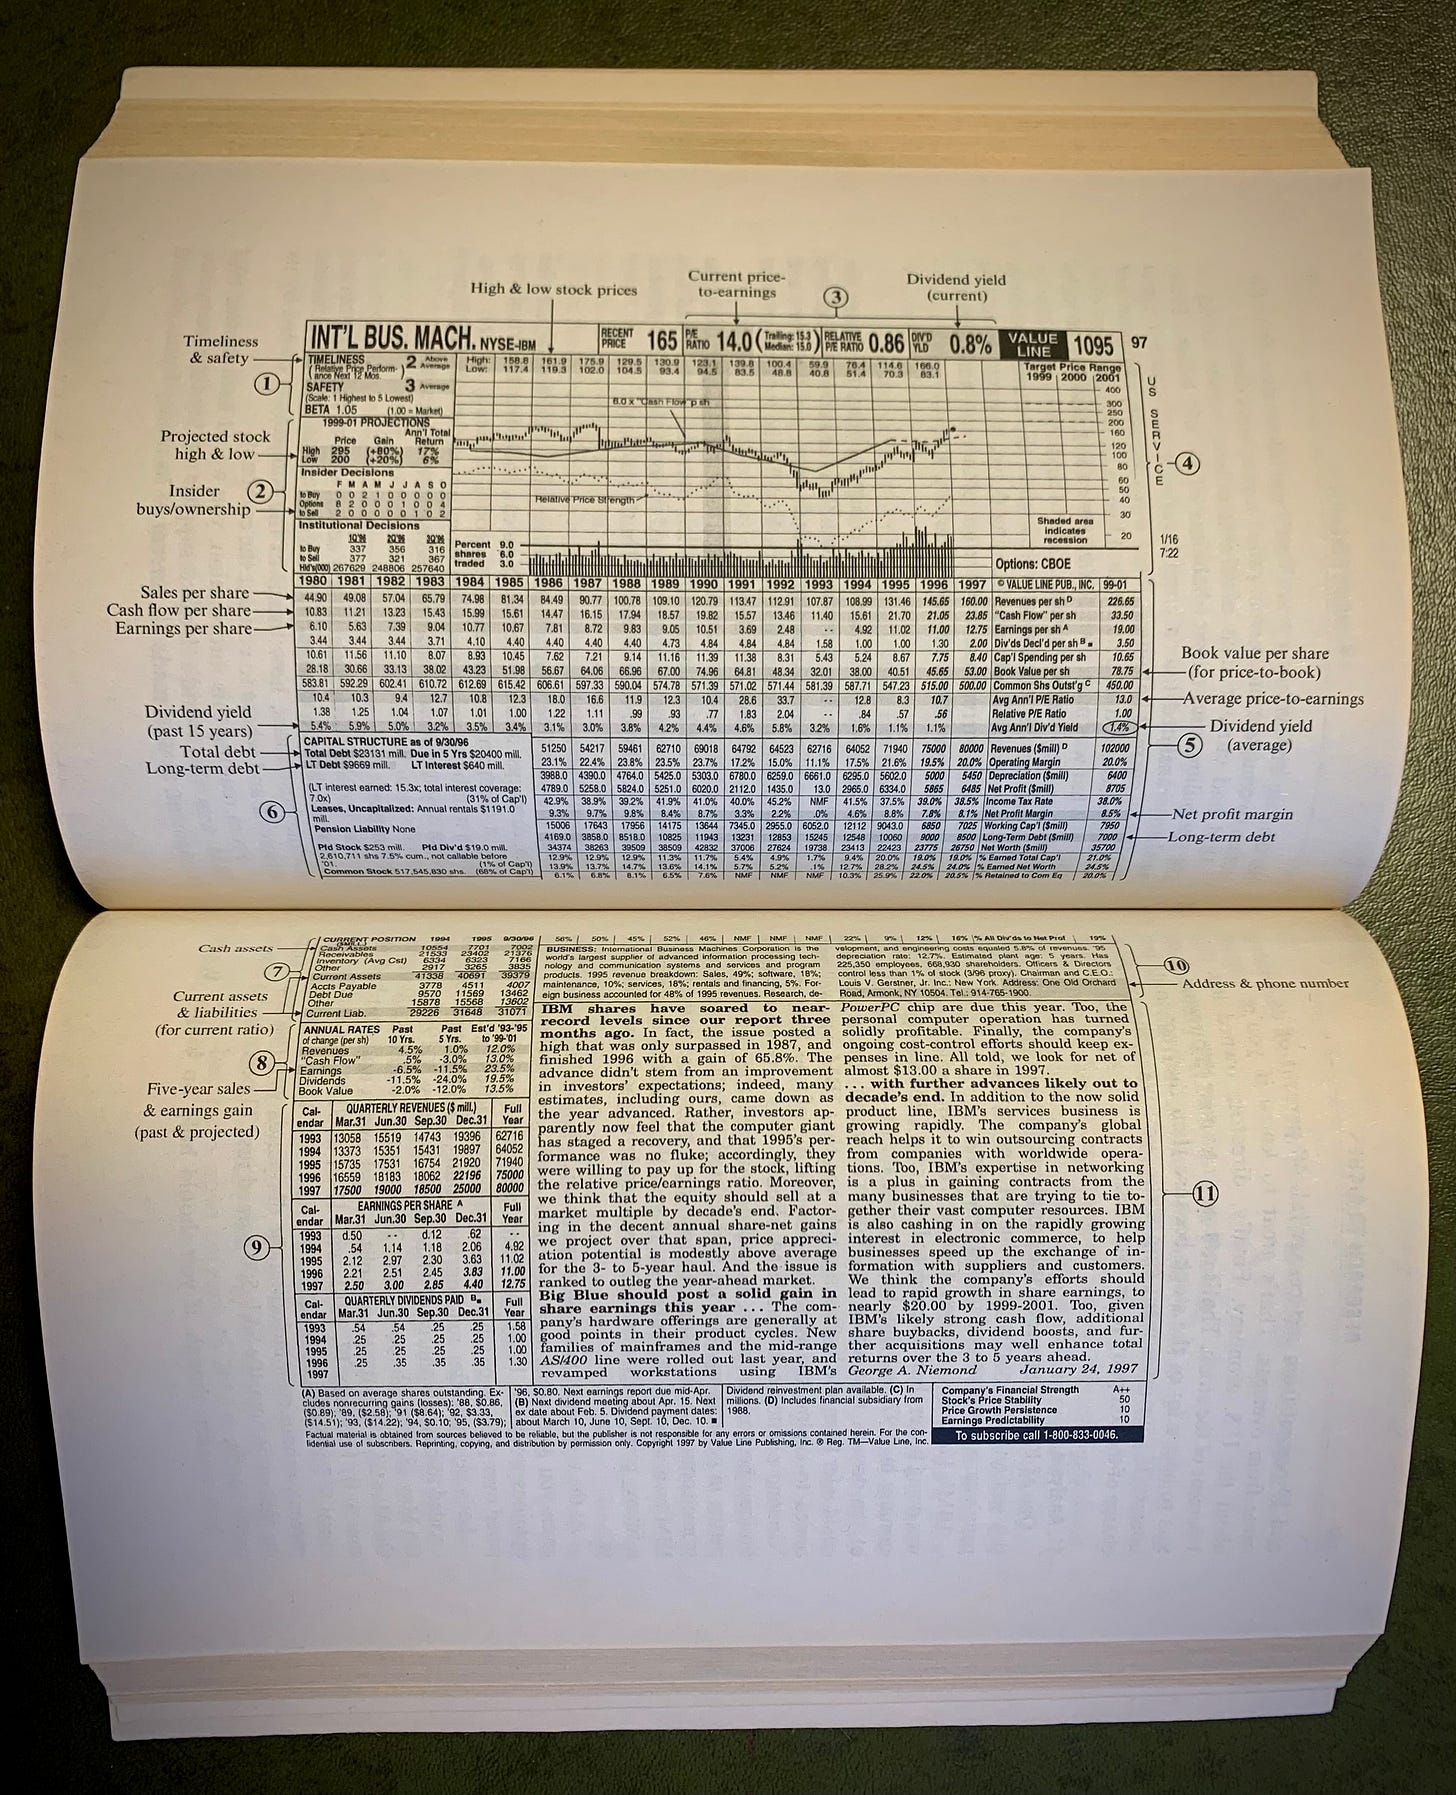
The book explains the 11 parts of a Value Line page, each numbered and called out on a two-page spread of IBM’s January 1997 report:
The 11 parts of the page are:
The Rankings
Price Projections and Insider Decisions
P/E Ratio and Dividend Yield
Price History Chart
Historical Financial Measurements
Capital Structure
Current Position
Annual Rates
Quarterly Financials
Business
Analysis
In this Part 4 of Research to Riches, let’s see what has changed and what has stayed the same in Value Line.
The Technical Rank
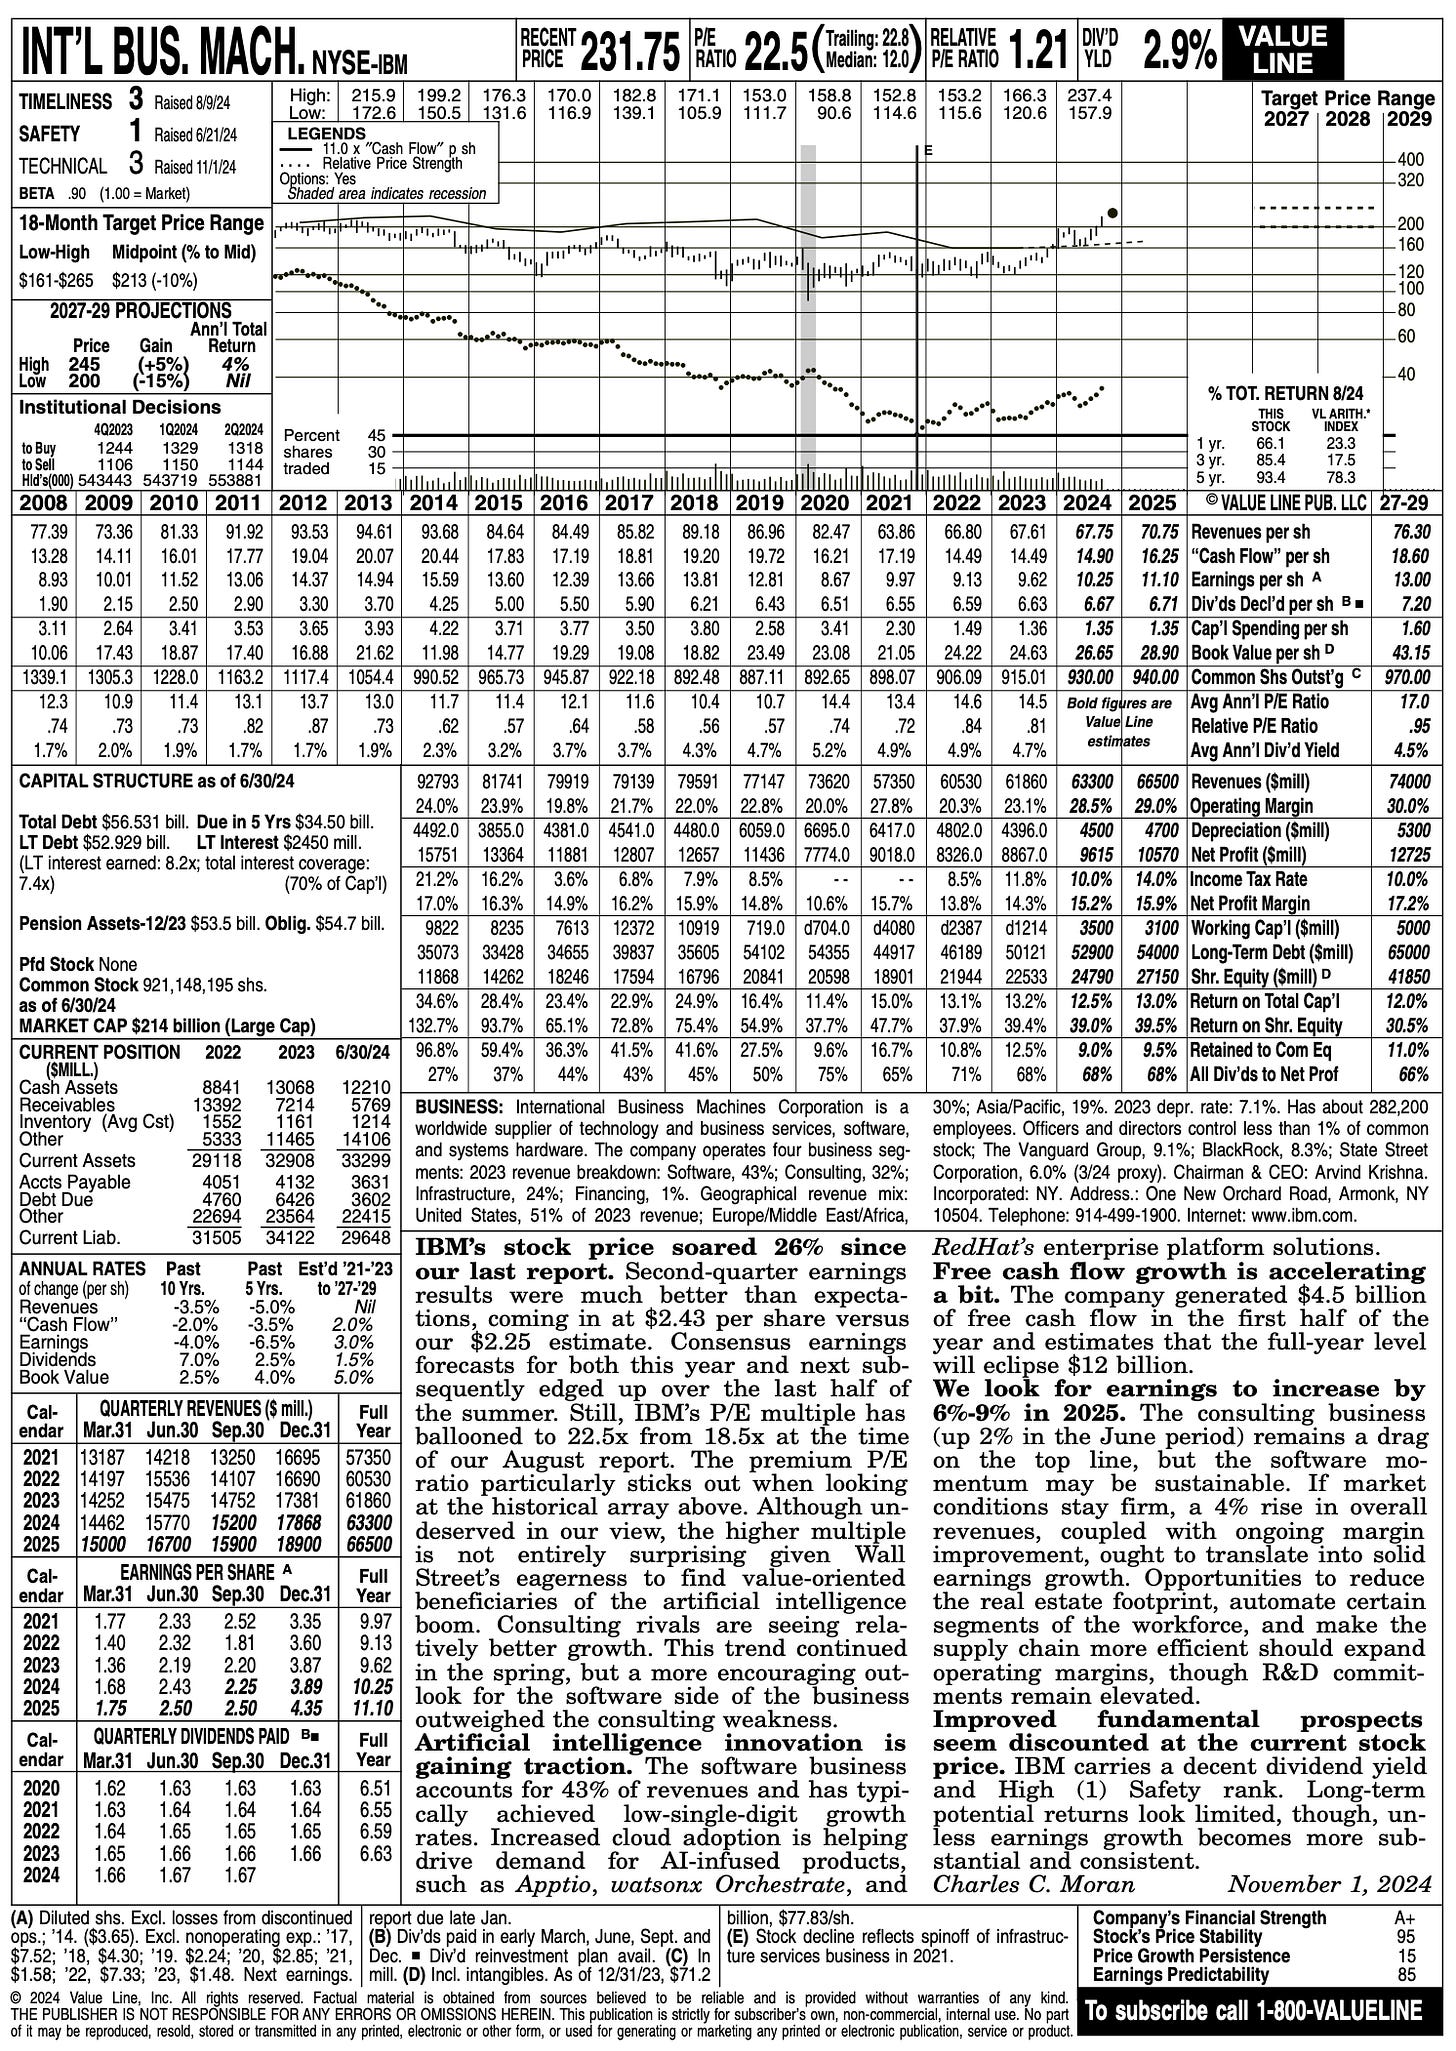
The following is IBM’s November 2024 Value Line report:
Isn’t it nice to see something stay basically the same over time? Value Line is like the wheel: never new, never improved.
According to the company, you’ll find everything “you need to evaluate a stock, on a single page” from this “continually updated database of the most actively traded stocks on the North American exchanges in over 90 industries.” The reports are “packed with detailed current and historical financial data, 3-to 5- year price and earnings projections, 18-month target price range, and unbiased commentaries” from Value Line’s expert analysts.
The fundamentals of stock investing haven’t changed in many decades, if ever. From time immemorial stock investors have wanted to pay as little as possible for future cash flows. To analyze that, measurements conveying the worthiness of a business remain constant. How much profit does it make? What are its margins? How much debt does it carry? Is it growing, and, if so, how quickly? What is its dividend yield?
Conclusions based on the standard set of information change over time, such as the willingness to pay a higher earnings multiple for a higher growth rate, but the set of information that is pertinent for evaluation has been the same my whole life. Value Line’s reliable single-page format makes this clear.
The main change since 1997 is so small you’d be forgiven for failing to notice. In the upper-left corner, just below Timeliness and Safety, is a “new” ranking: Technical.
I write “new” in quotes because it’s not all that new. In fact, it shows up in IBM’s January 2012 Value Line report on page 186. About it, I wrote in the fifth edition:
Move your eyes down and notice a small change in the profile, the addition of the technical rank below the safety rank. It looks at the stock’s relative price performance over the past 52 weeks and then ranks the stock based on how well it should perform against the market in the near term. Stocks ranked 1 or 2 should outperform the market in the next quarter or two, stocks ranked 3 should follow the market, and stocks ranked 4 or 5 should underperform the market.

The technical rank probably seems a lot like the timeliness rank to you. The way they’re different is that timeliness considers the company’s earnings when projecting near-term performance; the technical rank does not. It considers only stock price performance. Which should take precedent? Timeliness. Straight from Value Line’s glossary comes this handy tip: “Under no circumstances should the technical rank replace the timeliness rank as the primary tool in making an investment decision. Over the years, the timeliness rank has had a superior record.” Of course, seeing both ranked 1 or 2 would be best of all.
The company still stands by that characterization. From the Value Line Ranking System Guide (emphasis added):
The Value Line Ranking System for Timeliness™ ranks approximately 1,700 stocks relative to each other for price performance during the next six to 12 months. Value Line has utilized this proprietary Ranking System since 1965, assigning ranks from 1 (Highest) to 5 (Lowest). Stocks that receive a Timeliness™ Rank of 1 or 2 are expected to show stronger relative price performance than the remaining stocks in the same time period. At any given time, 100 of the 1,700 stocks are ranked 1 and 300 more ranked 2, giving investors dozens of investment options in the market segments they prefer. The top-ranked stocks for Timeliness™ cannot be expected to outperform the market in every single week but, over a longer period of time, they are predicted to do so as a group, as our actual results demonstrate. …
Rank 1 (Highest): These stocks, as a group, are expected to be the best performers relative to the Value Line universe during the next six to 12 months (100 stocks). …
The Value Line Technical Rank is designed to predict stock price movements over a three- to six-month time period. In each case, stocks are ranked from 1 to 5, with 1 being the highest ranking. Further, it is based on price movement factors, and should be considered in conjunction with the Timeliness rank.
An Excellent Digital Edition
Just because Value Line has been around forever and keeps churning out the same reliable report format quarter after quarter doesn’t mean it hasn’t kept up with the times. Its digital edition is excellent.
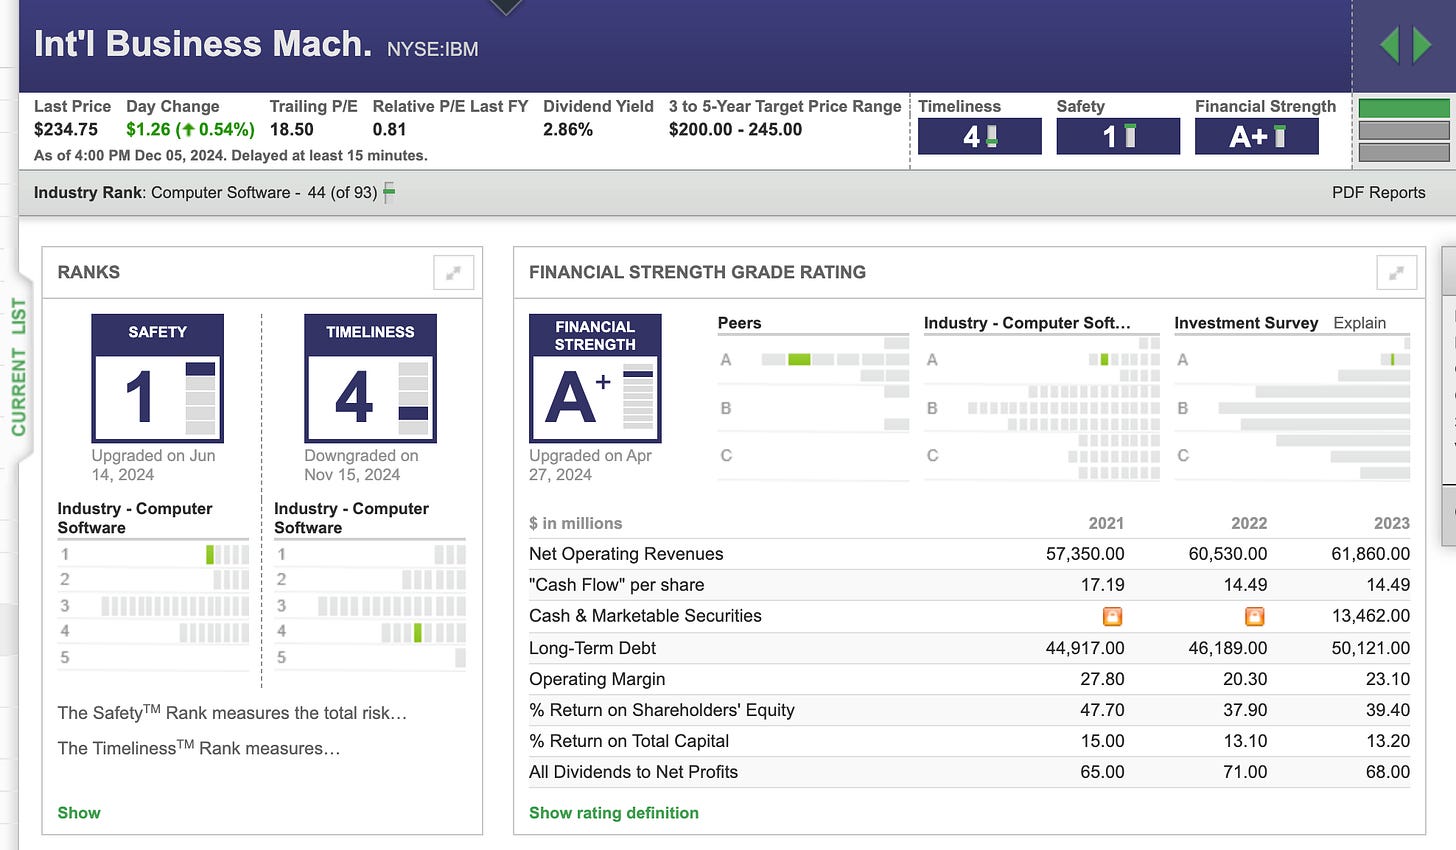
The following is a screen shot of the top of IBM’s November 2024 Value Line report, repackaged for digital display:
The blocks can be rearranged on the page to suit your preference, and you can even hide ones you don’t care about. You might have thought at first glance, Where’s the Technical rank? Farther down the page, in its own block:
The digital edition makes it easier to look back through past reports for comparison. For example, below is the commentary box, with easy-click access to previous quarterly commentaries:
Subscription Details
Value Line offers a number of products in addition to its flagship Investment Survey.
Others include a survey of small- and mid-cap stocks ($249/yr), coverage of 600 large-cap stocks ($199/yr), and The Value Line Information You Should Know — Wealth Newsletter ($49/yr). Whatever your budget, there’s a place for you in Value Line’s catalog.
The digital edition of its flagship service costs $598 per year. The print and digital combo costs $718:
You’ll find Value Line in many public libraries. Check with your local library to see if you can access the service using just your library card.
Coming in Part 5: Companies Themselves.


